
Third Quarter 2024
Two strong back-to-back quarters for emerging market stocks, up 14.87% last quarter (VWO). Emerging market indices include a healthy dose of Chinese stocks. At the end of the 3rd quarter, China’s central bank announced a stimulus plan to help accelerate their economy, which explains their sharp rise in late September. The US Stock market (SPY) continues to charge forward, gaining 10.57% last quarter. Moderate risk diversified portfolios (AOR) were up 8.06%. In the final week of the 3rd quarter, developed international markets (VEA) managed to surpass the bond market (BND), which went up 6.96% and 6.04% respectively.
This chart helps illustrate how each of these major asset classes and the moderate risk diversified portfolio performed throughout the quarter.

Here are some further details on each product:
VEA, Vanguard FTSE Developed Markets: This product represents the developed international equity/stock market.
SPY, SPDR S&P 500: This product represents the U.S. equity/stock market.
BND, Vanguard Total Bond Market: This product represents the U.S. bond market.
VWO, Vanguard FTSE Emerging Markets: This product represents the emerging equity/stock market.
AOR, iShares Growth Allocation: This product represents a moderate risk diversified portfolio. This product does not necessarily match how your diversified portfolio is allocated. You can find your allocation within the report that we send you each quarter.
Presidential Elections & Market Performance
With the election less than 30 days away I feel compelled to include at least one chart on elections and market performance. Since 1928, this is the 3rd best start for US stocks during an election year. The S&P 500 is up 19.5% through the end of August, more than doubling the average of 8.2%. The graph on the right-hand side shows that the remaining 4 months are typically strong when we get off to a great start during the first 8 months.

Golden Rule #1: Don’t Fight the Fed
The Federal Reserve cut rates by 0.50% in September, and more rate cuts are expected. Falling rates are usually good for the economy and the stock market because they encourage people to borrow money and/or to spend or invest savings accounts. The only time falling rates turn into a bad scenario is when a recession surfaces. On the left-hand side of the chart, it shows that when the Fed starts cutting rates with no ensuing recession, the market averages 18.5%. However, when the Fed starts cutting rates and a recession begins, the market averages -3.1%. So, we need to keep a close eye on the economy for signs of a looming recession.

The US Recession Probability Model has done a good job at identifying recessions since 1980. The grey shaded areas show previous recessions, and the blue line represents the probability of a recession. When the probability score exceeds 50% then a recession becomes more likely. The most recent score is 13.8%, showing that a recession is currently unlikely. Recessions surface rather quickly, so we will be watching this model closely.

Golden Rule #2: Don’t Fight the Tape
The tape refers to the prevailing trend of the stock market. If the trend is positive, stay invested. If the trend is negative, get out. There are lots of different models that track the trend in the tape, but my favorite just happens to be the simplest. The chart below compares the 50-day & 200-day moving average for US stocks. When the 50-day (in orange) is above the 200-day (black dashes) then more recent stock prices have been moving up faster than longer term stock prices. The current data supports a positive trending market, confirming our overweight stock exposure.

Flagship Risk Model
Our primary risk model started the 3rd quarter at the lower end of the neutral zone and finished the quarter at the upper end of the neutral zone. It also spent some time in the top bullish zone (which supports buying stocks and taking risks) during the quarter, which aligns with the positive performance we saw this quarter.

Hedging Protocol (Risk Management Tool)
Our hedging protocol looks at 49 different indicators that have been selected based on their historical track record at identifying market risk (past performance is not indicative of future results). 34 of these indicators come from Ned Davis Research (NDR), an independent research group, and the remaining 15 indicators were chosen by our investment committee to complement NDR’s indicators. Together they provide us with the ability to observe risk as it unfolds to help us determine if trades are needed to manage risk within your diversified portfolio.
Below is our stock/equity exposure for each risk profile from the beginning to the end of the quarter:
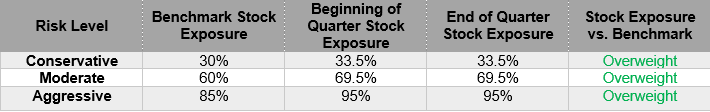
We continue to monitor each of the indicators for guidance on how much risk we should be taking within your portfolio. We will be sure to let you know if/when we make changes to our hedging protocol, but for the time being, we are happy with how we have your portfolio positioned.
Upcoming Events
CIO’s Corner: Quarterly Update Webinar with Chief Investment Officer, Chris Gauthier, CFA
November 6, 2024 at 12:00 PM EST
Quarterly Tip
On a regular basis we monitor client taxable accounts under our management in search of positions at a loss. If the loss is large enough, then we often liquidate the position to lock in the loss. We do this because losses can offset profitable trades, dollar-for-dollar, which helps reduce or eliminate capital gain taxes. The current challenge is that we are having trouble finding positions at a loss.
If you have a taxable account that you manage yourself, please look to see if any of the positions in the account are currently at a loss. You may want to consider liquidating the position to lock in the loss. If you believe in the position and want to buy it back, just be mindful of the wash sale rule where you cannot buy the stock (or another that is substantially identical) 30-days before or after the sale.
Please reach out to your Stonehearth advisor if you have any questions.