
Second Quarter 2024
Last quarter, emerging markets (VWO) finished ahead of the pact (+4.74%), with US large cap stocks (SPY) right behind (+4.56%). Moderate risk diversified portfolios (AOR) finished in the middle (+1.96%) while bonds (BND, +0.79%) and developed international stocks (VEA, -0.18%) finished at the bottom of the major asset classes. Overall, a decent quarter. Not as good as the first quarter, but still respectable.
The chart below helps illustrate how each of these major asset classes and the moderate risk diversified portfolio performed throughout the quarter.

Here are some further details on each product:
VEA, Vanguard FTSE Developed Markets: This product represents the developed international equity/stock market.
SPY, SPDR S&P 500: This product represents the U.S. equity/stock market.
BND, Vanguard Total Bond Market: This product represents the U.S. bond market.
VWO, Vanguard FTSE Emerging Markets: This product represents the emerging equity/stock market.
AOR, iShares Growth Allocation: This product represents a moderate risk diversified portfolio. This product does not necessarily match how your diversified portfolio is allocated. You can find your allocation within the report that we send you each quarter.
Presidential Elections & Market Performance
There is so much data out there showing past performance of markets under a Republican versus a Democratic presidency, an incumbent versus a new presidency or a 1 or 2 term presidency. No doubt, the President holds a lot of power, but there are built-in checks and balances to limit that power. As you can see below, the market performs pretty well over long periods of time no matter who sits in the oval office.

Presidential election years tend to be good years, averaging +11.6% per year since 1926.

Presidential election years (below in orange) have produced the best performance in the 3rd quarter, averaging +6.2%. Surprisingly, “all years” (below in yellow) produced the worst performance in the 3rd quarter, averaging +2.4%. And remember, “all years” includes election years. This just shows how tough the 3rd quarter tends to be.

New Highs
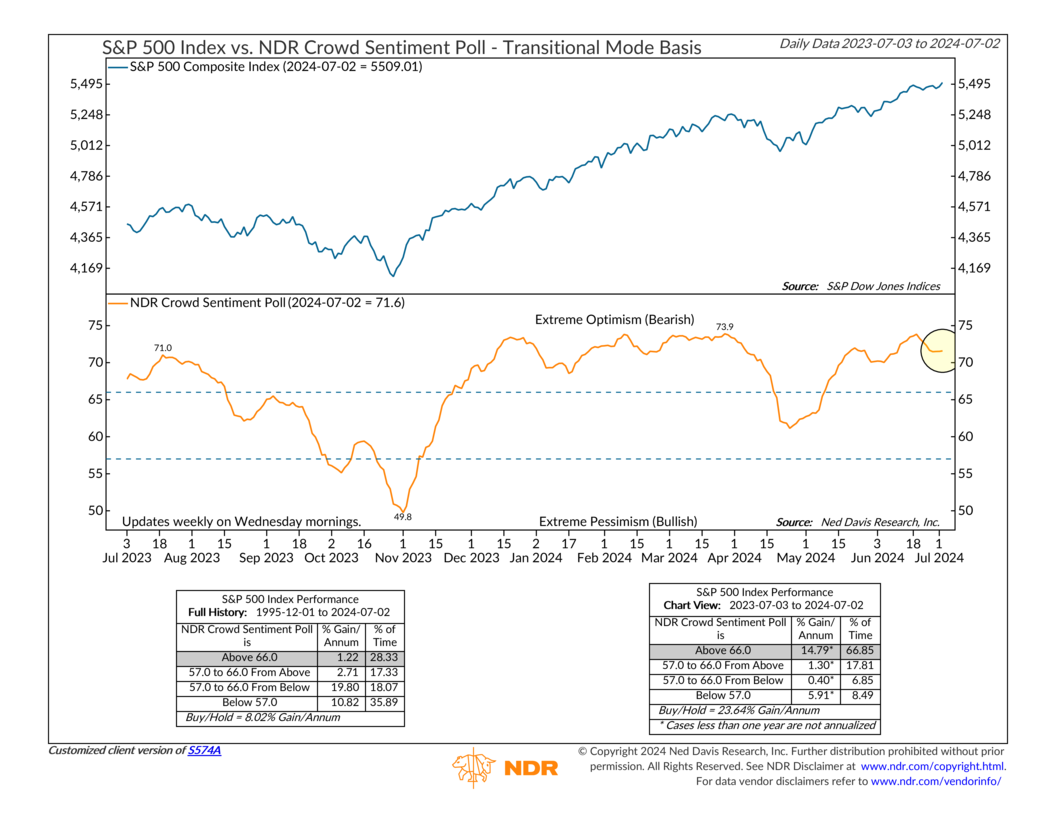
Currently, investors are feeling pretty optimistic about the stock market (orange line below, right hand side). New highs in some of the largest stock markets will tend to do that. You may notice on the chart that the current zone is labelled “extreme optimism” and then in parentheses is says “bearish.” Extreme optimism in a contrarian indicator, which means it is so good that it is actually bad. Since 1995, the extreme optimism zone has produced the weakest performance averaging +1.22% per year for the S&P 500 index. Interestingly, since last summer that zone has produced the best performance at +14.79%.
This market continues to be driven by the performance of only a handful of stocks. In fact, one stock, Nvidia, through June, accounted for roughly a third of the performance of the S&P 500 index in the first half of the year. Think about that for a moment.
Below is a list of the top 10 stocks in the S&P500 at the end of June, which combined now make up over 35% of the index.

The S&P 500 index is a cap-weighted index. This means that larger companies make up a larger percentage of the index. If we compare the year-to-date performance of the S&P 500 (SPY, purple line below) to an equal-weighted version of the same index where each stock’s weight is 1/500th (RSP, orange line below) then we can see a huge discrepancy in performance (+15.23% vs +4.96%).
As you know, we manage diversified portfolios and your portfolio performs better when lots of stocks are performing well, as opposed to a few. This typically resolves itself overtime but requires patience.

Federal Reserve & Interest Rates
The Federal Reserve’s job is to keep inflation low and employment strong. Their primary tool to accomplish this is controlling interest rates. We are likely getting closer to a rate cut. My best guess right now is that we will see our first rate cut at the December 2024 Fed meeting, but it has been clear that they will remain data dependent.
Inflation came down quickly from the July 2022 highs, but has plateaued since July 2023, hovering around 3%-4%. The Federal Reserve wants to see inflation at 2%, so the Fed will likely keep rates high until they see inflation resume its decent.

Overall, jobs are strong. We are seeing a slight increase in unemployment, but nothing alarming just yet. This too supports the idea that the Fed can wait longer before reducing interest rates.

Interest rate reductions are usually good for both stock and bond markets. However, rate cuts followed shortly after by a recession are typically bad news for stocks (-5.6% vs +21.0%) but still okay for bonds (7.7% vs 8.0%). Fortunately, there are few recessionary signs right now, but we need to remember that recessions are sneaky and are hard to predict. In fact, the official committee that calls the start of a recession only does so when they have the luxury of hindsight.

Flagship Risk Model
The primary risk model that we use has fallen into the “neutral” zone. It has clearly weakened in the second quarter despite positive performance for most asset classes. Interestingly, over the last 12-months the neutral zone has produced the best performance (+19.74%). We are not yet ready to reduce equity risk, but we are watching this closely.

Hedging Protocol (Risk Management Tool)
Our hedging protocol looks at 49 different indicators that have been selected based on their historical track record at identifying market risk (past performance is not indicative of future results). 34 of these indicators come from Ned Davis Research (NDR), an independent research group, and the remaining 15 indicators were chosen by our investment committee to complement NDR’s indicators. Together they provide us with the ability to observe risk as it unfolds to help us determine if trades are needed to manage risk within your diversified portfolio.
Below is our stock/equity exposure for each risk profile from the beginning to the end of the quarter:
Conservative (benchmark = 30%): Beginning 30.0%, ending 33.5%.
Moderate (benchmark = 60%): Beginning 66.0%, ending 69.5%.
Aggressive (benchmark = 85%): Beginning 95%, ending 95%.
We continue to monitor each of the indicators for guidance on how much risk we should be taking within your portfolio. We will be sure to let you know if/when we make changes to our hedging protocol, but for the time being, we are happy with how we have your portfolio positioned.
Upcoming Events
CIO’s Corner: Quarterly Update Webinar with Chief Investment Officer, Chris Gauthier, CFA
August 14, 2024 at 12:00 PM, EST